SF Young Bay Mud
A brief review of index and consolidation properties
In October 2021, I relocated from the Upper Midwest to the San Franciscoi Bay Area. This technical note was part of my assignment to acquaint myself with the geology of the area. During that time, my beloved cat, Meao, passed away back home…In loving memory of Meao, I dedicate this.
Introduction
The Young Bay Mud (YBM) is a marine-deposited clay commonly found along the margins of the bay, between modern shorelines and the historical limit of tidal marsh. The YBM is composed of alluvial gray silty clay, with thin layers of silt and fine to medium grained sands, small amounts of organic material and shell fragments. Within developed areas and city limits, the YBM is generally buried under artificial fill; therefore, YBM is typically normally consolidated or slightly overconsolidated, i.e., OCR of between 1 and 3 (Bonaparte and Mitchell, 1979; Benoit and Clough, 1986; Koutsoftas et al., 2017). Where it is exposed at the surface, it can be desiccated and stiff with higher OCRs. There are mainly two types of YBM commonly encountered in the San Francisco Bay Area (Johnson and Bartow, 2019). The first type is very soft to soft clay with organic content (CH, OH). This type of soft bay mud is generally characterized by higher plasticity, higher moisture content, lower density, and low shear strength. The second type is more notable in its granular composition: sandy/silty clay (CL, SC) and silty sand (SM). This type of mud deposit primarily consists of soft to medium sandy clay or medium dense silty sand, having lower plasticity, lower moisture content, higher density, and higher shear strength. This technical note provides a brief review of the engineering properties, primarily the indices and consolidation properties of the first type of YBM, as it is more geotechnically concerning and applicable to the type of work discussed herein.
Index Properties
The engineering properties of YBM vary across the Bay Area. Table 1 presents a compilation of several index properties of Bay Mud from limited literature and author’s projects.
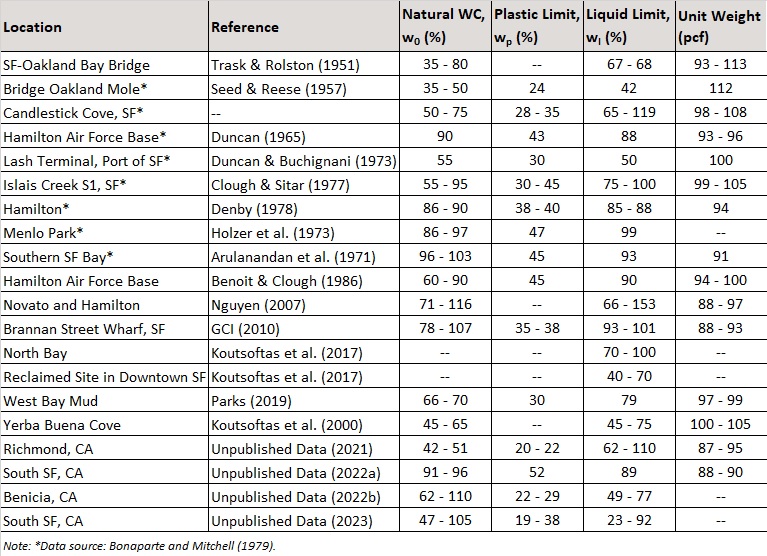
All data points, except the samples from the Bridge Oakland Mole and a couple others, have Liquid Limits (wl) of greater than 50% that indicates a high-plasticity or high-compressibility soil. If plotted on the plasticity chart, many of these data points also fall slightly above the A-line, which is a characteristic of many marine clays. If there is a presence of organic matter, the data points are located in the region below the A-line, e.g., plasticity index of 45% and Liquid Limit of 90% in Benoit and Clough (1986). The Liquid Limit represents the mineralogy of a soil, and often time, and can be empirically correlated to strength and other properties of a soil (Terzaghi et al., 1996). Soil with higher Liquid Limit or its natural water content (w0) closer to Liquid Limit tends to behave as a vicious fluid when sheared. In other words, a soil with higher Liquid Limit is highly sensitive like those of Scandinavian marine clays. A useful ratio to indicate sensitivity of soil is Liquidity Index (LI), defined as (w0 – wp) / (wl – wp). If LI is greater than 1, remolding transforms the soil into a thick slurry (highly sensitive); If LI is between 0 and 1, the soil behaves like plastic; if LI is negative, the soil cannot be remolded or will have brittle fracture when sheared. Bonaparte and Mitchell (1979) reported that LI for YBM is slightly above 1, which as described earlier, is a sensitive clay. Based on several other studies, Bonaparte and Mitchell (1979) summarized that typical values of YBM are: Liquid Limit at ±88% and natural water content slightly higher at about ±90%. However, because water content in most soils falls between its Plastic and Liquid Limits in its natural state, the author would like to caution the use of such “typical” values, especially the Liquid Limit, including those listed in Table 1 where the upper limits of w0 exceed the upper limits of Liquid Limit. Recall that the first type of YBM contains some amount of organic matter. When the soil sample is prepared in accordance with the ASTM standard, air- or oven-drying causes irreversible dehydration of organic matter, reducing the Liquid Limit (Terzaghi et al., 1996; Holtz and Kovacs, 1981). Therefore, the reported “typical” Liquid Limit value of ±88%, if prepared per the ASTM standard, is likely underestimated, and it is very likely that Liquid Limit is slightly above the natural water content. Often, the laboratory Atterberg Limits results are used to correct the classifications as observed in the field (i.e., CH vs. CL), while preparing boring logs. If in doubt of laboratory results, the engineer or geologist should check with the laboratory standard procedure and refer to the descriptive color (dark brown, dark gray, or black) of the retrieved samples for indications of organic materials.
Two other useful properties are specific gravity (Gs) and total unit weight. When evaluating consolidation test results or performing settlement analysis, specific gravity is needed to compute the void ratio. Bonaparte and Mitchell (1979) summarized that specific gravity of YBM is in the range of 2.69 to 2.73, with a mean value of 2.71. The specific gravity of a soil varies based on soil constituents, e.g., organic soil has a lower Gs value. Denby (1978) reported specific gravities ranging from 2.52 at a depth of 5 feet to 2.65 at 50 feet; and 2.75 below 75 feet from samples obtained in Hamilton. Therefore, it is reasonable to use a lower Gs value for those YBM with organic materials at shallow depths. Based on this and the typical w0 of 90%, the initial void ratio (e0) is roughly 2.3 for YBM with an organic content at shallow depths; and about 1.1 for YBM at greater depths with w0 of 40% and Gs of 2.70. These assume that soil stratum is fully saturated, i.e., e0 = w0Gs. It has been reported that the total unit weight of YBM is fairly constant with depth. At the Hamilton Air Force Base, Benoit and Clough (1986) reported a unit weight of 100 pcf in the upper 6½ feet and 94 pcf below that. Note that near-surface desiccation can cause denser soil state and organic soil tends to lower the total unit weight to around 90 pcf. For general engineering calculations, the author uses a total unit weight of 95 pcf for YBM, unless organic content is noticeable, then a lower total unit weight such as 90 pcf is used.
Drawing from the discussions above, readers can easily conclude that YBM is a highly sensitive and highly compressible clay. The sensitivity component is more prominent in stress or strength analysis, while compressibility is more noteworthy in seepage, consolidation, or settlement analysis. In soft ground engineering, it is always preferred to muck-excavate soft and compressible soil like YBM, and backfill with sand or engineered fill if it is practical and feasible to do so (also from the environmental standpoint). If a geotechnical engineer must deal with YBM, either ground improvement or deep foundations will be needed. It is important to note that the majority studies of the YBM’s engineering properties were originated from the Hamilton Air Force Base, and by now, the reader should know that engineering properties of YBM vary across the Bay Area. As a result, the author urges readers to exercise engineering judgement and perform supplemental laboratory or in situ testing to confirm properties in question.
Consolidation Properties during Primary Compression
The topic of consolidation properties of a soil normally encompasses the discussions of hydraulic properties, void ratio-effective stress relationship, and compressibility of a soil. This is because the void size, pore channel, and mineralogy of a soil directly control the drainage characteristics of a soil stratum, which drives the time-dependent consolidation process used in conventional settlement or even strength-gained analysis. In this section, we will mostly focus on the generalized primary consolidation parameters of YBM along with time-rate relationship used in settlement analysis.
\[\ S = \frac{C_{c}}{1+e_{0}}H_{0}\left(\frac{C_{r}}{C_{c}}\log\frac{\sigma^{\prime}_{p}}{\sigma^{\prime}_{v0}}+\frac{\sigma^{\prime}_{vf}}{\sigma^{\prime}_{p}}\right)\]The equation above describes the primary settlement based on vertical effective stress (i.e., excess pore water pressure, Δu ≠ 0). In this equation, a few consolidation parameters that we need are: Cc = compression Index; Cr = recompression Index; H0 = initial thickness; e0 = initial void ratio; and (σʹp/σʹv0) = Overconsolidation Ratio (OCR). This equation is useful because Cr can be estimated from an empirical database for Cr/Cc. The void ratio of soil stratum can be estimated using natural water content and Gs discussed earlier. Therefore, the important consolidation properties to be evaluated for settlement analysis are Cc and σʹp, which are best determined from oedometer tests.
The ratio of Cr/Cc typically falls within the range of 0.02 to 0.20 with lower values corresponding to highly structured and bonded soft clay and silt deposit and higher values corresponding to fissured clays and shales (Terzaghi et al., 1996). Other mentions of typical Cr/Cc values are between 0.05 and 0.10, with the lower values corresponding to lower plasticity and low OCR clays (Holtz and Kovacs, 1981). In many practical problems, the contribution of Cr to settlement is insignificant compared with that of Cc. This is especially true for YBM which we know is mostly normally- to slightly-overconsolidated. Unfortunately, there are not many mentions of reliable Cr/Cc in existing YBM literature. Nguyen (2007 reported Cr/Cc of 0.08 with considerably scattered data. By compiling data from three other studies, Bonaparte and Mitchell (1979) reported average Cr values of 0.12, 0.14, and 0.15 and average Cc values of 1.2, 1.52, 1.6 to 1.8 along the initial portion of the virgin compression curve, respectively. Based on these average values, the derived Cr/Cc ratios are 0.10, 0.10 and 0.08 to 0.09, respectively. As we can see, although the ratio falls within a narrow range, it is highly dependent on the interpretation of Cc values that will be discussed shortly. Despite that, for designing problems, it is reasonable to neglect recompression and assume virgin compression at an OCR=1; for backcalculation or verification problems, consideration for recompression must be paired with accurate determination of preconsolidation pressure, σʹp that is primarily derived from available laboratory or in situ testing data.
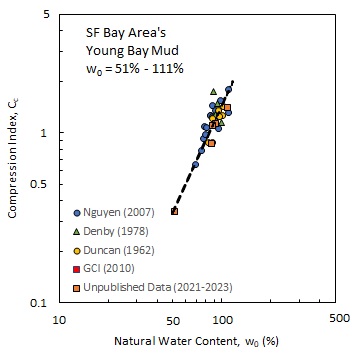
The mineralogy and structure of soil directly determine the natural water content and compression index of the soil. In salt-rich or marine environment, the flocculation or aggregation of clay particles causes more void spaces within the soil, allowing for higher water content to come at equilibrium. This is the case for YBM, whose higher natural water content leads to proportionally higher compressibility compared to low plasticity clays. When there is presence of organic content, the compression index is also higher given the higher water content. The empirical relationship between natural water content and Cc is presented on Figure 1. Roughly speaking, the relationship indicates that Cc increases at a rate of 15% per every 10% increase in the natural water content. For example, the Cc values are at around 1.3 for YBM with w0 of 90% and about 1.5 for organic YBM with w0 of 100%. Because Cc becomes non-linear at higher consolidation pressure, the Cc values in the figure were determined from the range of σʹp to 2σʹp. The use of natural water content to estimate compression index for YBM is useful compared to other known relationships between Cc and Liquid Limit due to the testing procedure described earlier. However, given the spread of the data, Cc is still best obtained from oedometer tests performed on high quality samples. As a note for determining σʹp or OCR, the author generally finds that Casagrande’s method works well.
Time-Rate of Consolidation
In Terzaghi’s one-dimensional consolidation theory, the coefficient of consolidation (cv) governs the consolidation process, as defined in the equation below:
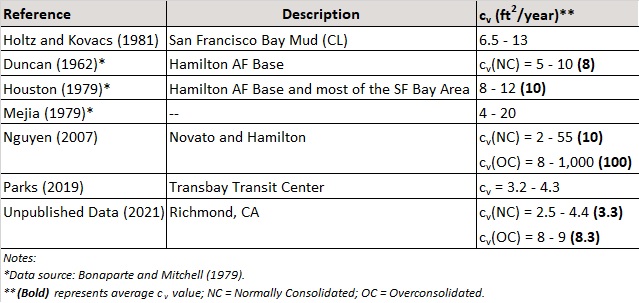
\[\ c_{v} = \frac{k}{γ_{w}}\frac{1+e_{0}}{a_{v}}\]Where k = permeability; γw = unit weight of water; and av = coefficient of compressibility = -(e2-e1)/(σʹ2-σʹ1). The coefficient depends on two important parameters: k and av, the latter of which resembles the form of Cc. In a way, cv considers the compressibility of soil such that higher av leads to smaller cv, given that k is constant. In practice, we assume cv as a constant to make the one-dimensional consolidation equation solvable. However, we know that Cc is nonlinear, as is av; and therefore, cv is not linear or a constant. Nonetheless, for the purpose of this technical note, Table 2 presents the “typical” cv values for YBM. At least several studies indicate that cv varies from about 5 to 20 ft2/year. When divided into virgin compression (NC) and recompression (OC) ranges, most cv values are at least 2 to 5 ft2/year in the NC range and at least 8 ft2/year in the OC range. Based on three studies, Bonaparte and Mitchell (1979) summarizes “typical” cv values of between 8 and 10 ft2/year.
There is no good agreement among the datasets. It is known that laboratory measured cv values tend to underestimate mobilized cv values in the field. Because of the inconsistencies between laboratory and field values of cv, the magnitude of cv is often emphasized rather than more precise values. These inconsistencies are conducive to geotechnical engineering in designing perspectives at the least. Some researchers (e.g., Parks, 2019) opined that the use of intermediate values, as opposed to lowest values, can be more useful for design. Using higher values might underestimate the time needed to achieve required settlement for design. In the past, the author used the lower values to estimate the time required to reach end-of-primary (EOP) settlement for organic soils or peat under embankment loads. This is because the permeabilities of organic soil and peat decrease dramatically when effective stress increases, meaning that the dissipation rate of excess pore water pressure reduces over time, i.e., Ck is low. This may not be the case for YBM. As of now, using low to intermediate values appears to be the most rational approach for designing purposes.
Additional Notes
Unpublished field settlement records in Richmond, CA indicated that average field mobilized cv values, backcalculated by using the Asaoka’s method, were an order magnitude greater than the design value of 20 ft2/year. The general thickness of YBM blanketed the Richmond’s site was approximately 5 to 10 feet underlain by interbedded alluvial strata prior to the new development. The author chose a design value of 20 ft2/year purely based on the previous project experiences working with peat and organic clays and the lack of personal experiences dealing with the YBM. As a result, the final design value was capped at 20. The surcharging period was shortened by about a month — contractor and client were happy. We were as well! — than the originally planned timeline.
The author is currently (patiently) waiting for another project to enter construction phase, and if so, may share additional field data. Let’s hope that will happen soon.
Thumbnail image generated by hotpot.ai
Last update: 4/2025