Digitizing CPT Plot
OpenCV | Data extraction by computer vision
Whether you are stumped over “how to deal with this CPT report” or are intimidated by “the lack of data,” “no budget for extra field work,” or the tedious hand scaling task among other issues, you may have come to the right place. In an attempt to make PDF data accessible for other purposes, I started a Python program using the computer vision libraries to extract data from the pixelated pages. My motivation was simple: to make my life processing data, especially historical CPT data, easier.
CPT data presented in the reports are typically not released to owners and end users.
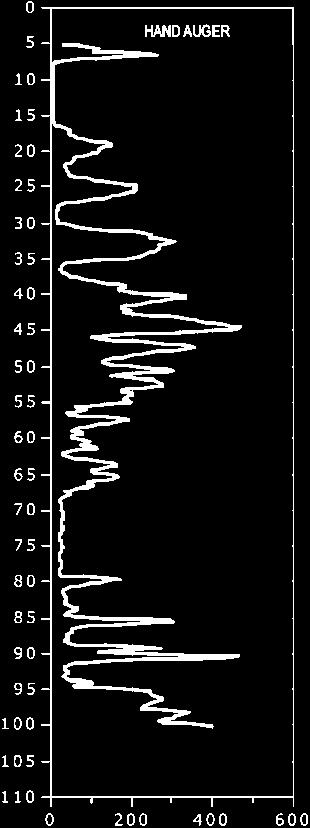
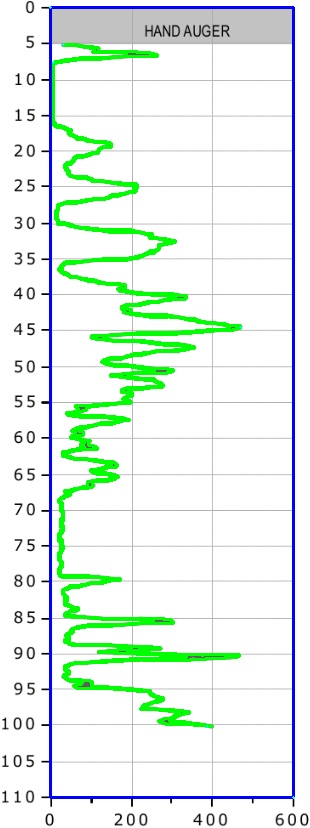
Extracting the data involves a number of imaging techniques, including thresholding, color filtering, and noise reduction, to trace the data line. Once the desired data line is traced, it is then scaled to the input scales. Figure 1 below presents an example CPT tip stress plot. The left figure is the original figure as included in reports with OTSU threshold applied, and the center and right figures present extracted features with different processing methods, overlying the original plot. It becomes evident that various processing methods return distinct features, which highly dictates the extraction accuracy. For example, data coverage in the right figure (method 2) is greater than the center figure (method 1). However, it does a worse job in capturing abrupt features (i.e., spike in tip stress).

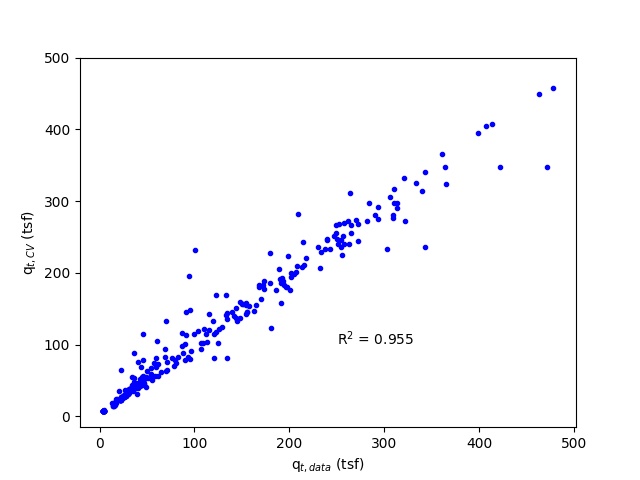
Plotting the actual data against the extracted data is a direct way to evaluate the linearity of two datasets. Furthermore, Pearson correlation analysis yields a result of r = .980, p = .000, indicating that both data are strongly correlated and statistically significant. Although this digitizing tool is not perfect, the output data, including tip stress (qt), sleeve friction (fs), and pore pressure (u), are around 5% error or less for use in analysis or design. As of now, the program is limited to PDFs and software-generated images. Further improvements in the development of distorted and scanned CPT plots, and better data capturing are under process.
Last update: 10/2023